How measuring impact can unlock investment in industrial clusters
econews. China's economic rise has leaned heavily on them. Since the 1980s, the government has built more than 1,400 industrial parks and special economic zones, which concentrate over 80% of the country’s industrial enterprises. Together, these industrial parks generate more than half of China’s gross industrial output, anchoring local economic growth and serving as a primary source of employment.
In Europe, around 3,000 industrial clusterssupport 54 million jobs. By concentrating companies, infrastructure and skills, these hubs have become important engines of regional competitiveness and industrial transformation.
Increasingly, industrial clusters, not individual facilities, are becoming the unit governments and investors use to decide where to invest. The European Union's Industrial Accelerator Act, proposed in March 2026, reflects this shift explicitly.
The Act requires member states to designate “industrial manufacturing acceleration areas”to facilitate the clustering of industrial manufacturing projects in strategic sectors. Doing so creates favourable conditions for coordinated industrial investment and development.
It also helps members to spot synergies, such as a shared hydrogen backbone or pooled logistics, that no single company could justify alone.
This creates new incentives for clusters to prove their ambition, impact and development potential.
Clusters that can show, credibly and consistently, how their GHG emissions are falling, economic contribution is growing, and the workforce is evolving can attract partners, unlock shared infrastructure, and make the case for the policy environment they need.
Gaining this visibility, though, requires a common language, which has been missing. Ask a factory manager how much GHG their plant emitted last year and most can tell you. Zoom out from the factory gate to the cluster it sits in – the port, the petrochemical park, the manufacturing corridor shared with a dozen neighbours – and the picture fragments.
Key metrics are calculated company by company, with different assumptions, base years and calculation methods, making it nearly impossible to get a true cluster-level view.
The business case for measuring together
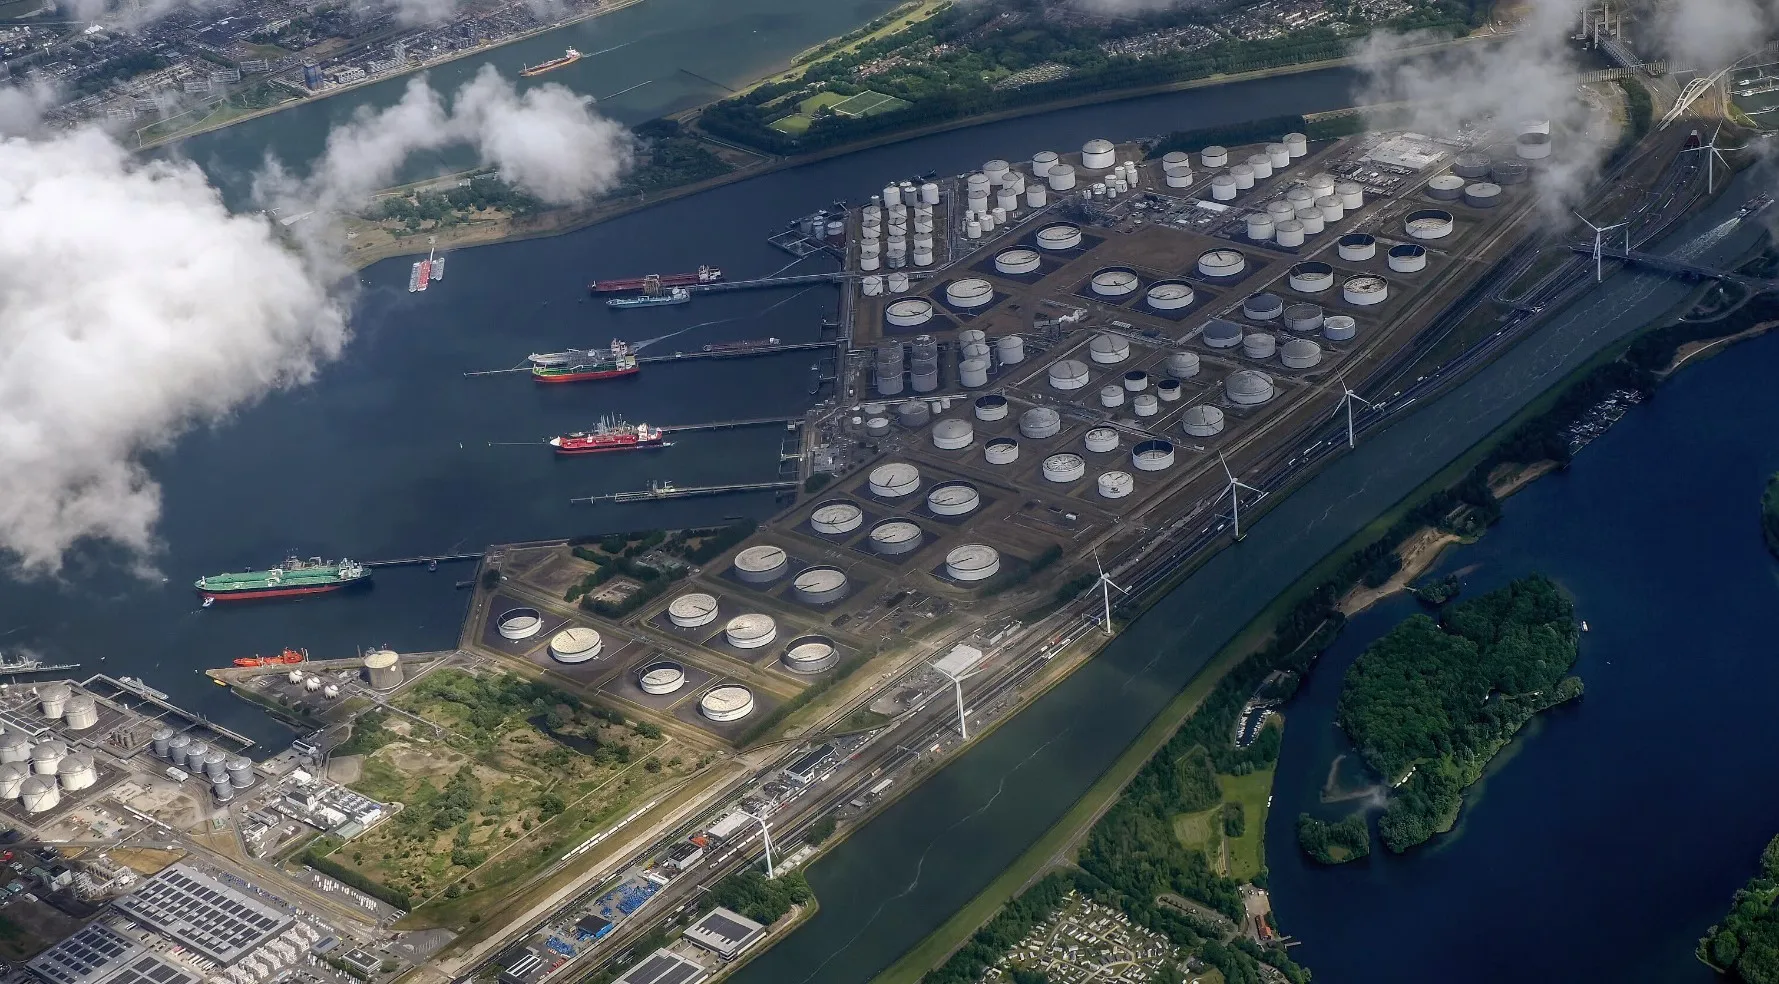
The Port of Rotterdam shows what becomes possible when a cluster can measure itself.
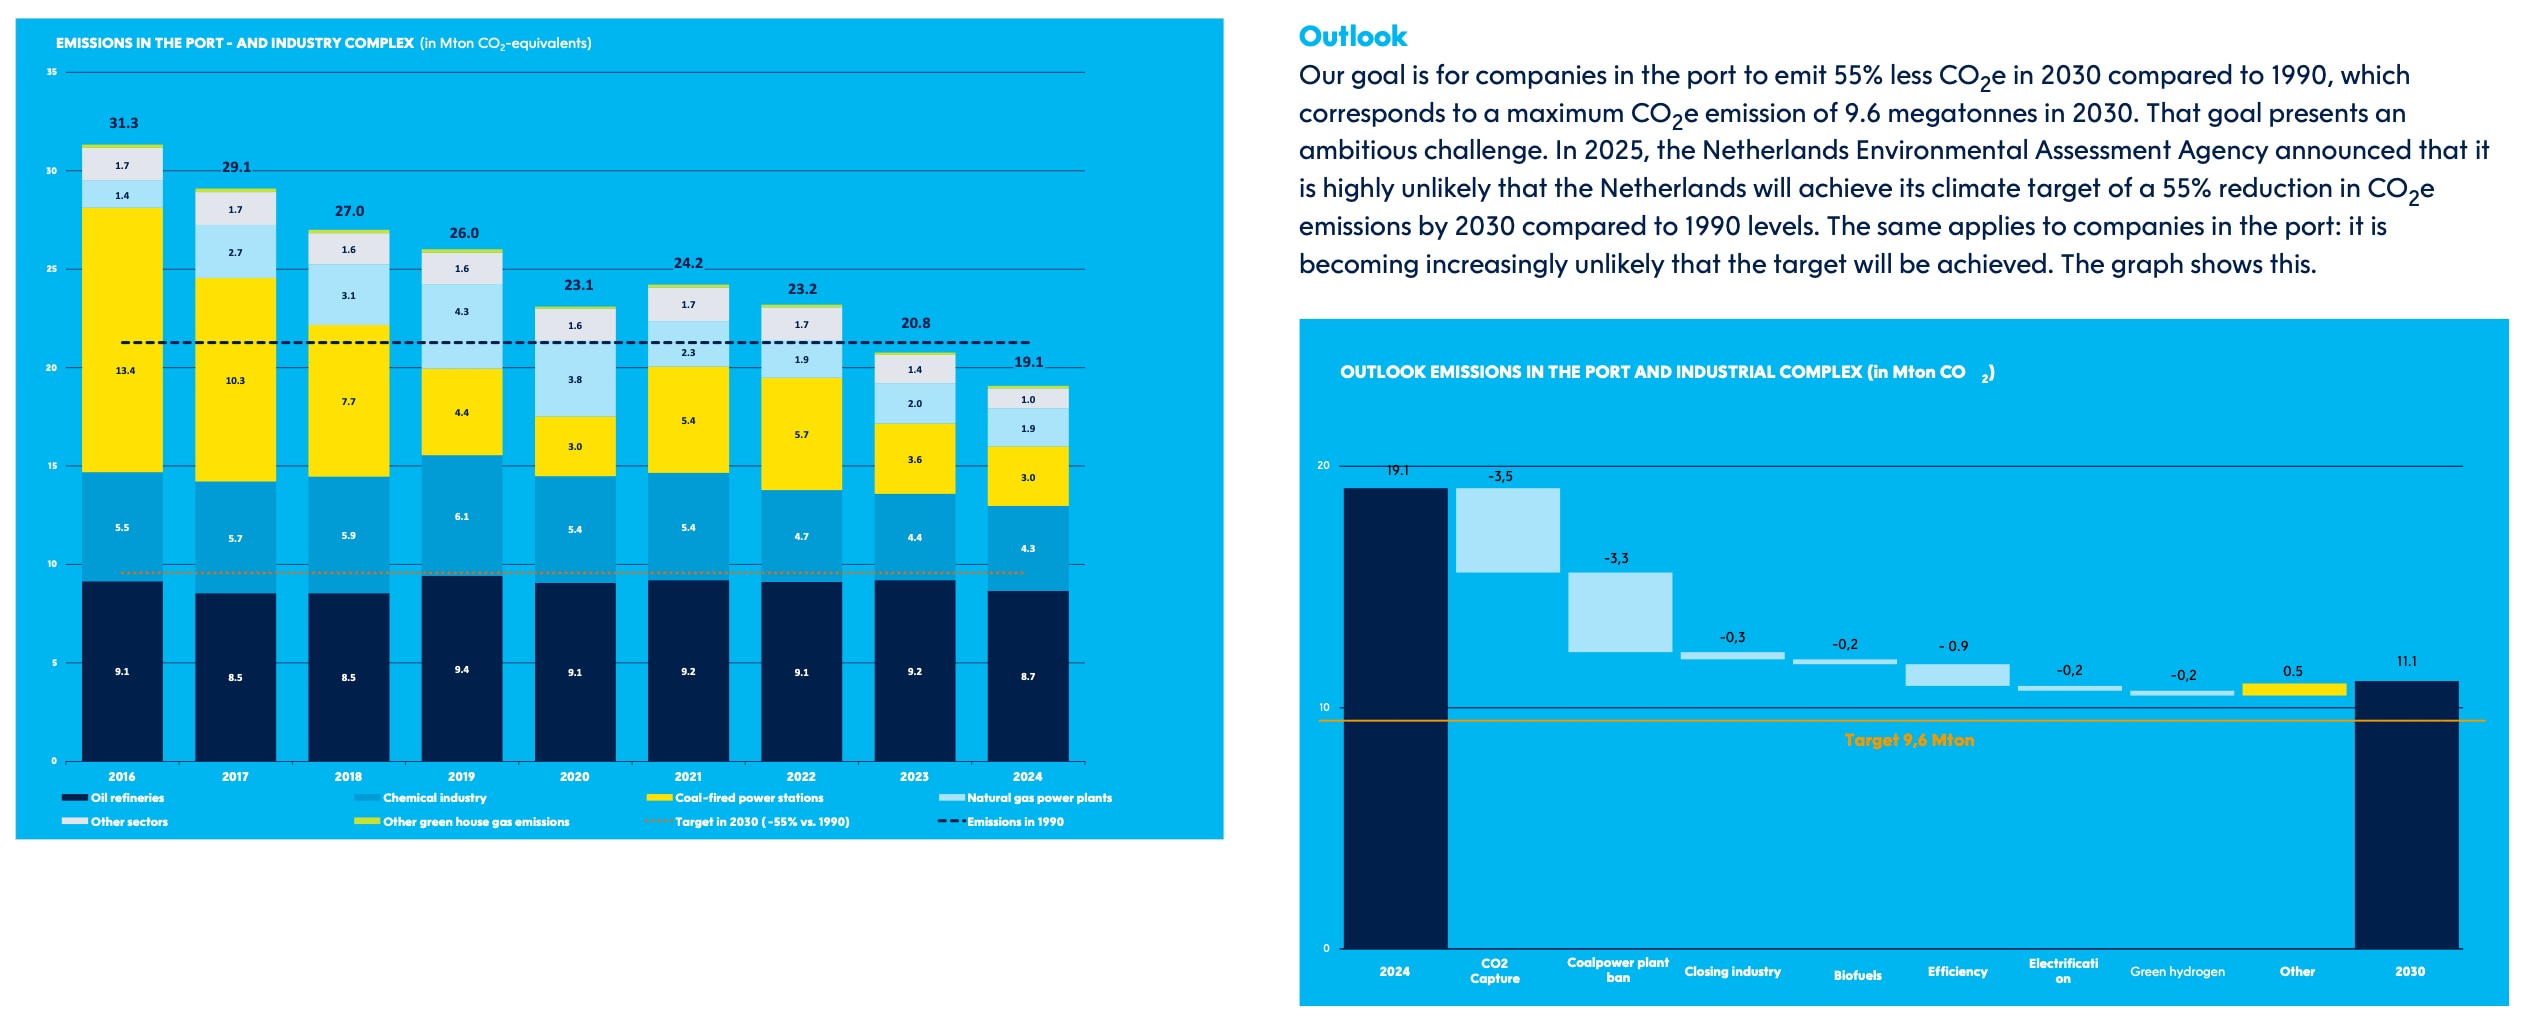
By tracking GHG emissions across its own operations, shipping and the wider port and industrial complex and updating progress annually, the Port Authority can model, lever by lever, what closing the remaining emissions gap requires: carbon capture, a coal-fired power plant phase-out, electrification and hydrogen.
That cluster-wide visibility has enabled the port authority to identify and back the shared infrastructure projects that deliver the greatest impact, such as Porthos CO2, a carbon capture and storage project requiring €1.3 billion in investment.
The port authority often acts as an investor and project developer in this shared infrastructure, using cluster-wide metrics to decide where to direct public capital and to encourage individual companies to convert their factories and build new low-carbon production facilities.
The same applies in other regions. In the United States, the Department of Energy's Regional Clean Hydrogen Hubs programme, funded through the Bipartisan Infrastructure Law, evaluated bids against cluster-wide key performance indicators rather than individual project pitches.
The programme’s future has faced uncertainty following the change in administration, with two hubs cancelled and federal support retained for the remaining five, while still subject to ongoing review.
Among these, the Appalachian Regional Clean Hydrogen Hub (ARCH2) was awarded up to $925 million after presenting projections of more than 21,000 jobs and roughly 9 million metric tons of CO2 (carbon dioxide) reduction a year. The HyVelocity Hub on the Texas Gulf Coast won up to $1.2 billion on a similar basis, estimating 45,000 jobs and up to 7 million metric tons of annual CO2 reduction.
In the United Kingdom, HyNet (covering the North West of England and North Wales) and the East Coast Cluster (spanning Teesside and the Humber) were selected as Track-1 CCUS clusters in 2021 through a sequencing process that required clusters to demonstrate their case against explicit criteria, including carbon abatement potential, jobs and investment gains.
Together, the two clusters are targeting the removal of 33 million tonnes of CO2 a year and the creation of 31,000 jobs, backed by around £22 billion in government funding over 25 years.
The common thread across Rotterdam, Appalachia, the Gulf Coast and the UK's Track-1 clusters is the same: governments and investors fund and prioritize clusters they can benchmark. Comparable, auditable metrics are what turn a cluster's ambitions into a claim that holds up to scrutiny.
How industrial clusters can start measuring impact
To help clusters gain this cluster-level view, the Transitioning Industrial Clusters initiative has published step-by-step methodologies for defining boundaries and baselines, establishing shared targets and tracking progress across GHG emissions reduction, GDP contribution, jobs and water use.
Specifically designed for cluster leads and core members, the documents help align internal processes with standardized metrics, enabling consistent reporting across regions.
This enables clusters to shape transition strategies and demonstrate collective impact across the dimensions that matter most to governments, investors and communities, while helping companies identify synergies and coordinate action.
by, World Economic Forum




- 1 ‘Immediate win for both presidents’ – expert on US-Russia diesel deal
- 2 Can Russia help ease tensions between Pakistan and Afghanistan?
- 3 Backlash in Kashmir over proposal for uniform Friday sermons across mosques
- 4 Why is China buying up gold?
- 5 Trump administration seeks to strip Ilhan Omar of US citizenship: WSJ